In the fast-evolving world of industrial maintenance, achieving operational excellence requires a data-driven approach. Maintenance Metrics and KPIs (Key Performance Indicators) serve as critical tools for assessing and improving the efficiency, reliability, and cost-effectiveness of maintenance operations. For organizations aiming to thrive in Vietnam’s competitive manufacturing landscape, tracking these metrics is essential to minimizing downtime, optimizing resources, and ensuring equipment longevity. This comprehensive guide explores the most important maintenance metrics and KPIs, their roles, calculations, significance, and benefits.
I. What Are Maintenance Metrics and KPIs?
Maintenance metrics are quantifiable data points that measure various aspects of maintenance processes, such as equipment performance, downtime, and costs. KPIs, on the other hand, are specific metrics tied to strategic organizational goals, providing benchmarks to evaluate success.
The distinction lies in their scope: metrics provide raw data, while KPIs align this data with actionable goals. Together, Maintenance Metrics and KPIs enable maintenance managers to make informed decisions, optimize workflows, and align operations with broader business objectives like cost reduction and productivity enhancement.
II. Why Track Maintenance Metrics and KPIs?
Tracking Maintenance Metrics and KPIs transforms raw data into actionable insights, offering numerous benefits:
- Improved Decision-Making: Data-driven insights allow managers to prioritize tasks and allocate resources effectively.
- Enhanced Equipment Reliability: Metrics identify patterns, helping prevent unexpected failures.
- Cost Savings: Optimized maintenance reduces unnecessary expenses and downtime costs.
- Safety and Compliance: Monitoring metrics ensures adherence to safety regulations, reducing workplace risks.
- Prolonged Asset Life: Proactive maintenance extends equipment lifespan, maximizing return on investment.
In Vietnam, where industries like manufacturing and logistics face intense competition, leveraging these metrics is crucial for staying ahead. Tools like CMMS EcoMaint streamline this process by automating data collection and providing real-time insights.
III. Key Maintenance Metrics and KPIs to Track
Below, we dive into the most critical Maintenance Metrics and KPIs, detailing their definitions, calculations, significance, world-class benchmarks, applications, and benefits. These metrics are essential for any organization aiming to achieve world-class maintenance standards.
1. Mean Time Between Failures (MTBF)
MTBF measures the average time a piece of equipment operates before experiencing a failure, reflecting asset reliability.
Calculation
MTBF = Total Operating Time ÷ Number of Failures
Example: A machine operates for 2,000 hours in a month and fails 4 times. MTBF = 2,000 ÷ 4 = 500 hours.
Significance
A higher MTBF indicates more reliable equipment, reducing the frequency of disruptions. It’s a lagging indicator that helps predict future performance and optimize maintenance schedules.
World-class MTBF varies by industry but typically ranges from 500 to 2,000 hours for critical equipment.
Applications
- Scheduling preventive maintenance to address potential issues before failures occur.
- Identifying unreliable assets that may require replacement or upgrades.
- Comparing equipment performance across facilities to standardize best practices.
Benefits
- Reduces unplanned downtime.
- Enhances production planning by predicting equipment availability.
- Supports data-driven decisions for equipment investments.
2. Mean Time to Repair (MTTR)
MTTR calculates the average time required to restore equipment to full functionality after a failure, including diagnosis and repair.
Calculation
MTTR = Total Repair Time ÷ Number of Repairs
Example: A machine requires 20 hours of repair across 5 incidents. MTTR = 20 ÷ 5 = 4 hours.
Significance
A lower MTTR reflects an efficient maintenance team, minimizing production losses. It highlights bottlenecks in repair processes and technician training needs.
World-class MTTR is typically under 4 hours for critical assets, though this varies by equipment complexity.
Applications
- Streamlining repair workflows to reduce downtime.
- Training technicians to improve diagnostic and repair efficiency.
- Automating work order tracking with tools like CMMS EcoMaint to monitor repair times.
Benefits
- Decreases production interruptions, ensuring consistent output.
- Improves technician productivity by identifying inefficiencies.
- Enhances customer satisfaction by maintaining delivery schedules.
IV. Overall Equipment Effectiveness (OEE)
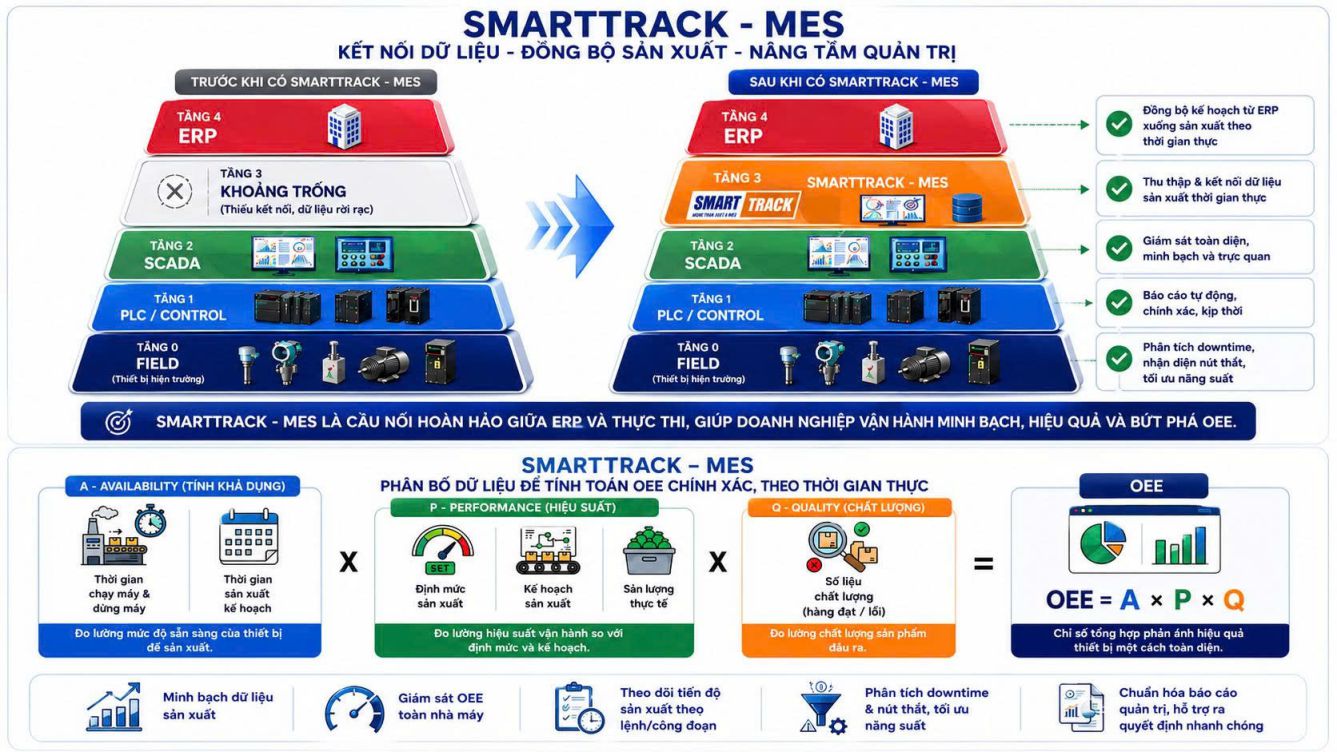
OEE is a comprehensive metric evaluating equipment efficiency through three factors: Availability, Performance, and Quality.
Calculation
OEE = Availability × Performance × Quality
- Availability = Actual Operating Time ÷ Planned Production Time
- Performance = Actual Production Rate ÷ Ideal Production Rate
- Quality = Good Units Produced ÷ Total Units Produced
Example: A machine runs for 420 minutes out of a 480-minute shift (Availability = 420 ÷ 480 = 0.875). It produces 800 units against an ideal rate of 1,000 units per shift (Performance = 800 ÷ 1,000 = 0.8). Of 800 units, 760 meet quality standards (Quality = 760 ÷ 800 = 0.95). OEE = 0.875 × 0.8 × 0.95 = 0.665 or 66.5%.
Significance
OEE provides a holistic view of equipment performance, identifying inefficiencies in production processes. It’s a critical KPI for assessing manufacturing effectiveness.
An OEE of 85% or higher is considered world-class, with 60%-85% indicating room for improvement.
Applications
- Pinpointing production bottlenecks, such as slow cycle times or quality issues.
- Guiding investments in new equipment or process improvements.
- Monitoring the impact of maintenance strategies on production output.
Benefits
- Increases productivity by optimizing equipment usage.
- Reduces waste, improving cost efficiency.
- Enhances product quality, boosting customer satisfaction.
4. Planned Maintenance Percentage (PMP)
PMP measures the proportion of maintenance hours dedicated to planned activities versus total maintenance hours.
Calculation
PMP = (Planned Maintenance Hours ÷ Total Maintenance Hours) × 100
Example: A team spends 250 hours on planned maintenance out of 300 total maintenance hours. PMP = (250 ÷ 300) × 100 = 83.33%.
Significance
A high PMP indicates a proactive maintenance strategy, reducing reactive repairs and unplanned downtime. It’s a leading indicator of maintenance program maturity.
World-class PMP is 90% or higher, with 70%-90% considered acceptable.
Applications
- Scheduling routine inspections and preventive maintenance tasks.
- Reducing emergency repairs by addressing issues proactively.
- Using CMMS EcoMaint to automate maintenance schedules and reminders.
Benefits
- Lowers downtime by preventing unexpected failures.
- Optimizes resource allocation, reducing overtime costs.
- Enhances equipment reliability and lifespan.
5. Preventive Maintenance Compliance (PMC)
PMC tracks the percentage of preventive maintenance tasks completed on schedule.
Calculation
PMC = (Number of PM Tasks Completed on Schedule ÷ Total Number of PM Tasks) × 100
Example: Out of 100 scheduled PM tasks, 90 are completed on time. PMC = (90 ÷ 100) × 100 = 90%.
Significance
High PMC ensures that preventive maintenance is performed consistently, reducing the risk of equipment failures.
A PMC of 90% or higher is world-class, with tasks completed within 10% of the scheduled interval (e.g., within 3 days for monthly tasks).
Applications
- Monitoring adherence to maintenance schedules.
- Identifying scheduling conflicts or resource shortages.
- Automating task tracking with CMMS EcoMaint for real-time compliance reports.
Benefits
- Prevents equipment breakdowns, reducing repair costs.
- Improves safety by ensuring equipment operates within specifications.
- Enhances audit readiness for regulatory compliance.
6. Maintenance Backlog
Maintenance backlog represents the total pending maintenance work, measured in hours or weeks.
Calculation
Maintenance Backlog = Total Hours of Pending Maintenance Work ÷ Total Available Maintenance Hours
Example: A team has 400 hours of pending work and 1,000 available maintenance hours. Maintenance Backlog = (400 ÷ 1,000) × 100 = 40% or approximately 2 weeks at full capacity.
Significance
A controlled backlog ensures that maintenance tasks are completed without overwhelming the team, preventing equipment failures and safety issues.
A backlog of 2-4 weeks is ideal, balancing productivity and capacity.
Applications
- Prioritizing critical tasks to prevent delays in essential operations.
- Allocating resources efficiently to clear backlogs.
- Using CMMS EcoMaint to centralize and prioritize work orders.
Benefits
- Reduces the risk of equipment failures due to delayed maintenance.
- Improves team productivity by streamlining task prioritization.
- Enhances operational continuity by addressing urgent tasks promptly.
7. Equipment Downtime
Equipment downtime measures the percentage of time equipment is unavailable due to maintenance or failures.
Calculation
Equipment Downtime = (Total Downtime Hours ÷ Total Operating Hours) × 100
Example: A machine is down for 15 hours in a 300-hour production month. Equipment Downtime = (15 ÷ 300) × 100 = 5%.
Significance
Minimizing downtime is critical for maintaining productivity and meeting production targets. It’s a lagging indicator of maintenance effectiveness.
World-class downtime is less than 5%, with top performers achieving under 2%.
Applications
- Identifying recurring issues causing downtime through root cause analysis.
- Scheduling preventive maintenance during off-peak hours.
- Using CMMS EcoMaint to track downtime patterns and predict failures.
Benefits
- Boosts production output by maximizing equipment availability.
- Reduces financial losses from unplanned outages.
- Improves customer satisfaction by ensuring timely deliveries.
8. Maintenance Cost as a Percentage of Replacement Asset Value (RAV)
This metric compares annual maintenance costs to the replacement value of assets, assessing cost-effectiveness.
Calculation
Maintenance Cost as a Percentage of RAV = (Total Maintenance Cost ÷ Total Asset Replacement Value) × 100
Example: Annual maintenance costs are $10,000 for an asset valued at $200,000. Maintenance Cost as a Percentage of RAV = (10,000 ÷ 200,000) × 100 = 5%.
Significance
A lower percentage indicates a cost-effective maintenance strategy, balancing repair costs with asset value.
World-class benchmarks are typically 2%-3% of RAV, though this varies by industry.
Applications
- Evaluating the financial efficiency of maintenance programs.
- Deciding whether to repair or replace aging equipment.
- Tracking costs with CMMS EcoMaint for budget optimization.
Benefits
- Reduces unnecessary maintenance spending.
- Guides investment decisions for asset replacements.
- Enhances financial planning by forecasting maintenance budgets.
9. Asset Utilization
Asset utilization measures how efficiently equipment is used compared to its maximum capacity.
Calculation
Asset Utilization = (Actual Output ÷ Maximum Possible Output) × 100
Example: A machine produces 800 units against a capacity of 1,000 units per month. Asset Utilization = (800 ÷ 1,000) × 100 = 80%.
Significance
High asset utilization indicates optimal equipment use, maximizing return on investment.
An asset utilization rate of 85%-95% is considered optimal.
Applications
- Identifying underused or overworked equipment.
- Optimizing production schedules to balance workloads.
- Monitoring utilization trends with CMMS EcoMaint.
Benefits
- Increases production efficiency without additional investments.
- Reduces wear and tear from overuse, extending equipment life.
- Improves resource allocation for maximum productivity.
10. First Pass Yield (FPY)
FPY measures the percentage of products or tasks completed correctly without requiring rework.
Calculation
FPY = (Number of Units Completed Without Rework ÷ Total Number of Units Produced) × 100
Example: Out of 1,000 units produced, 950 pass quality checks without rework. FPY = (950 ÷ 1,000) × 100 = 95%.
Significance
A high FPY indicates efficient processes and high-quality output, reducing waste and rework costs. An FPY of 95% or higher is world-class.
Applications
- Improving quality control processes to minimize defects.
- Training technicians to enhance first-time repair accuracy.
- Using CMMS EcoMaint to track quality metrics and identify issues.
Benefits
- Reduces production costs by minimizing rework.
- Enhances product quality, boosting customer satisfaction.
- Streamlines operations by improving process efficiency.
V. How to Implement Maintenance Metrics and KPIs Effectively
To maximize the value of Maintenance Metrics and KPIs, organizations should follow a structured approach:
· Define Objectives: Align metrics with business goals, such as reducing downtime or cutting costs.
· Select Relevant Metrics: Choose metrics that directly impact your objectives, such as MTBF for reliability or PMP for proactive maintenance.
· Establish Baselines: Set initial benchmarks based on historical data or industry standards.
· Collect Data: Use tools like CMMS EcoMaint to automate data collection and ensure accuracy.
· Analyze Trends: Regularly review data to identify patterns and areas for improvement.
· Take Action: Implement changes based on insights, such as adjusting schedules or training staff.
· Communicate Results: Share KPI reports with teams and stakeholders to align efforts.
· Review and Adjust: Continuously refine metrics and targets to reflect evolving business needs.
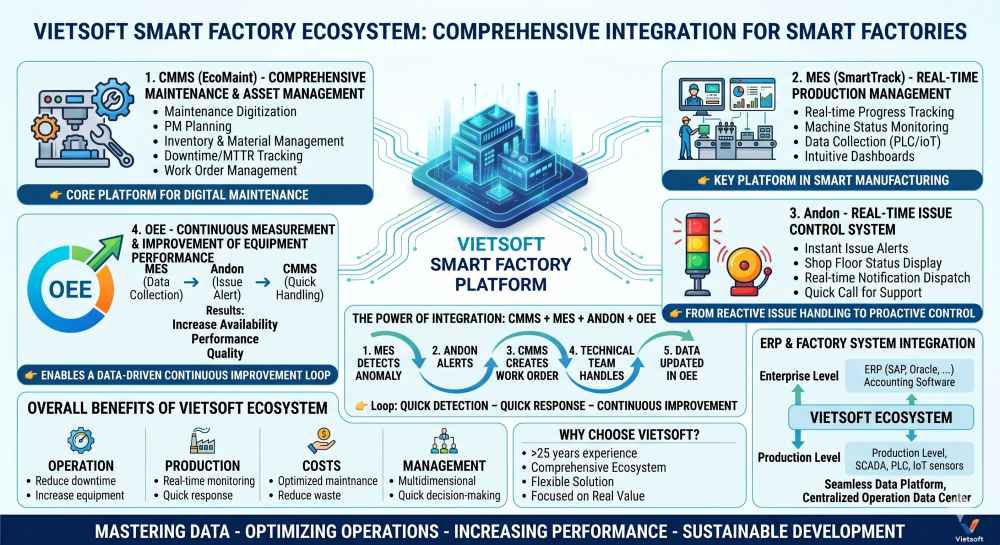
VI. The Role of CMMS EcoMaint in Tracking Maintenance Metrics
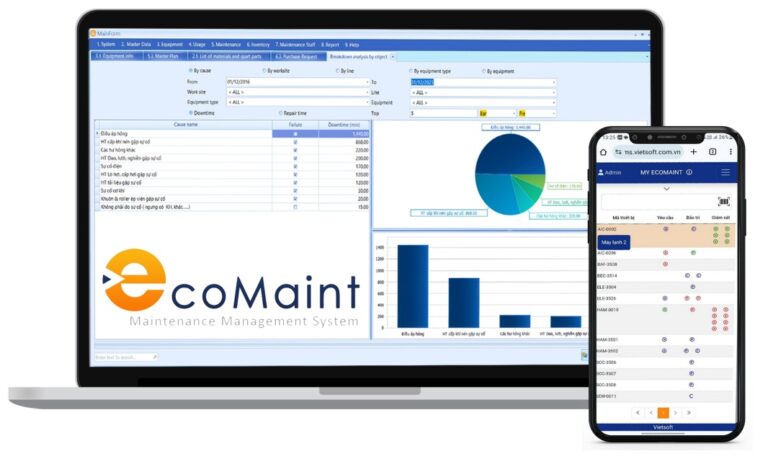
Vietsoft’s CMMS EcoMaint is a powerful tool for tracking and optimizing Maintenance Metrics and KPIs. Designed for Vietnam’s industrial sector, this software centralizes maintenance data, automates workflows, and provides real-time insights to drive efficiency. Key features include:
- Automated Work Orders: Streamlines task assignment and tracking, improving work order completion rates.
- Real-Time Reporting: Generates dashboards for metrics like MTBF, MTTR, and OEE, enabling quick decision-making.
- Preventive Maintenance Scheduling: Ensures high PMC and PMP by automating task reminders.
- Downtime Tracking: Identifies patterns to minimize equipment downtime.
- Cost Management: Tracks maintenance costs against RAV, optimizing budgets.
- Mobile Access: Allows technicians to update tasks on the go, boosting productivity.
By integrating CMMS EcoMaint, organizations can transform maintenance from a reactive burden into a proactive asset. For example, a manufacturing plant in Vietnam using CMMS EcoMaint reduced downtime by 25% and increased PMP to 90% within six months, showcasing its impact on achieving world-class maintenance standards.
Learn more about CMMS EcoMaint here.
Contact us for consultation via hotline: 0986778578 or email: sales@vietsoft.com.vn.
VII. Challenges of Tracking Maintenance Metrics Without CMMS
Manual tracking of Maintenance Metrics and KPIs poses significant challenges:
- Limited Visibility: Spreadsheets and paper logs lack real-time insights, delaying decision-making.
- Inconsistent Data: Manual processes are prone to errors, reducing accuracy.
- Time-Consuming: Manual calculations divert resources from core maintenance tasks.
- Scalability Issues: Manual systems struggle to handle large datasets in growing operations.
- Compliance Risks: Inaccurate records can lead to regulatory penalties.
CMMS EcoMaint addresses these challenges by automating data collection, centralizing information, and providing actionable insights, ensuring compliance and efficiency.
VIII. Best Practices for Optimizing Maintenance Metrics
To achieve world-class maintenance, consider these best practices:
- Start with a Few Key Metrics: Focus on 5-7 metrics to avoid data overload, such as MTBF, MTTR, OEE, PMP, and PMC.
- Leverage Technology: Use CMMS EcoMaint to automate tracking and reporting.
- Train Your Team: Ensure technicians understand how to use CMMS tools and interpret metrics.
- Set SMART Goals: Align KPIs with Specific, Measurable, Achievable, Realistic, and Timely objectives.
- Regularly Review Data: Conduct monthly or quarterly reviews to adjust strategies.
- Engage Stakeholders: Share insights with management and technicians to foster collaboration.
IX. Conclusion
Maintenance Metrics and KPIs are the backbone of a proactive, data-driven maintenance strategy. By tracking metrics like MTBF, MTTR, OEE, PMP, PMC, and others, organizations can optimize equipment performance, reduce costs, and enhance operational efficiency. In Vietnam’s competitive industrial landscape, tools like Vietsoft’s CMMS EcoMaint empower maintenance teams to achieve world-class standards by automating data collection, streamlining workflows, and providing real-time insights.
Ready to transform your maintenance operations? Explore how CMMS EcoMaint can help you track and optimize your Maintenance Metrics and KPIs for maximum efficiency.