In the fast-evolving world of industrial maintenance, staying ahead requires more than just keeping equipment running—it demands a data-driven approach to optimize performance, reduce costs, and enhance safety. Key Maintenance Statistics provide critical insights into trends, challenges, and opportunities that maintenance professionals and facility managers cannot afford to ignore. These statistics serve as a compass, guiding decisions on maintenance strategies, technology adoption, and workforce planning. In this comprehensive guide, we explore the role of Key Maintenance Statistics, their applications, benefits, and the latest trends shaping the maintenance industry in 2025..
I. What Are Key Maintenance Statistics?
Key Maintenance Statistics refer to quantifiable metrics that measure the performance, efficiency, and impact of maintenance activities within an organization. These metrics include indicators like downtime, maintenance costs, work order completion rates, Mean Time Between Failure (MTBF), and Overall Equipment Effectiveness (OEE). They provide a clear picture of how well maintenance strategies are performing and highlight areas for improvement.
II. Why Are Key Maintenance Statistics Important?
These statistics are the backbone of informed decision-making in maintenance management. They help organizations:
- Identify inefficiencies: Pinpoint bottlenecks in workflows or equipment performance.
- Reduce costs: Highlight opportunities to cut unnecessary expenses, such as reactive maintenance or overstocked inventory.
- Improve uptime: Ensure equipment availability to maximize production.
- Enhance safety: Reduce risks by addressing potential issues before they escalate.
- Drive strategic planning: Guide investments in technology, training, and process improvements.
By leveraging Key Maintenance Statistics, maintenance teams can transition from reactive to proactive strategies, aligning with modern industry demands for efficiency and sustainability.
III. The Role of Key Maintenance Statistics in Maintenance Management
1. Guiding Maintenance Strategies
Key Maintenance Statistics act as a roadmap for selecting and refining maintenance strategies. For instance, statistics showing high reactive maintenance hours (e.g., 49% of maintenance activities are reactive, per McKinsey) indicate a need to shift toward preventive or predictive maintenance to reduce downtime and costs.
2. Supporting Technology Adoption
With 59% of facilities using Computerized Maintenance Management Systems (CMMS) and 57% of service providers planning to integrate AI and IoT by 2026 (Plant Engineering, Global Growth Insights), Key Maintenance Statistics highlight the growing reliance on technology. Metrics like work order completion rates or equipment downtime can justify investments in tools like CMMS or predictive maintenance platforms.
3. Enhancing Workforce Efficiency
Statistics reveal that 73% of businesses struggle to hire skilled maintenance technicians (McKinsey). By tracking metrics like wrench time (time spent on actual maintenance tasks) or task estimating accuracy, managers can optimize workforce allocation and identify training needs.
4. Promoting Sustainability and Safety
Key Maintenance Statistics also underscore the environmental and safety benefits of proactive maintenance. For example, preventive maintenance can reduce raw material usage by 20% and vehicle emissions by 30% (Hrcak, ResearchGate). Additionally, maintenance-related fall protection violations resulted in $47.4 million in fines in 2023 (MSC), emphasizing the need for data-driven safety improvements.
IV. Top Key Maintenance Statistics for 2025
Below, we dive into the most critical Key Maintenance Statistics for 2025, drawn from industry reports and enriched with expert insights. These metrics are organized into key categories to provide a holistic view of the maintenance landscape.
V. Key Maintenance Statistics for Market Dynamics and Growth
1. Global MRO Market Growth
The global Maintenance, Repair, and Operations (MRO) market is projected to reach $842.6 billion by 2033, growing at a CAGR of 2.33% from 2025 (imarc). Europe currently holds a 32.7% market share, driven by stringent regulations and advanced industrial infrastructure.
2. Predictive Maintenance Market Expansion
The predictive maintenance market, valued at $7.85 billion in 2022, is expected to soar to $60.13 billion by 2030, with a CAGR of 29.5% (Grand View Research). This growth is fueled by AI, machine learning, and IoT adoption, enabling precise failure predictions.
VI. Key Maintenance Statistics for Technology Adoption Trends
3. CMMS Adoption Rates
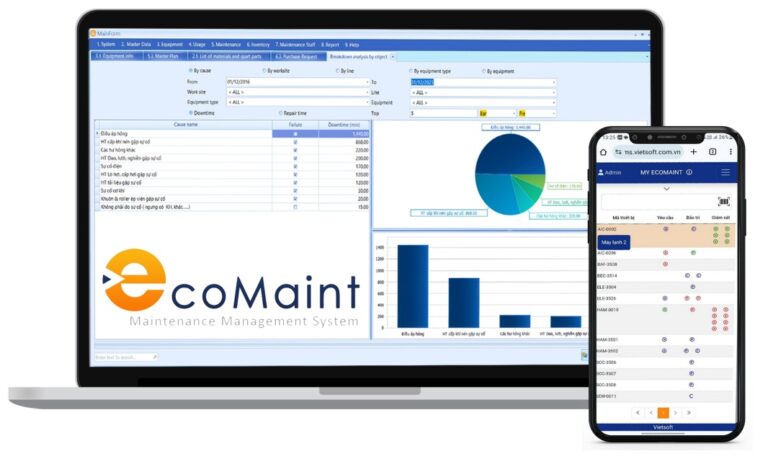
59% of facilities use CMMS software to manage maintenance operations, with 30% adopting cloud-based solutions and 22% using hybrid systems (Plant Engineering). CMMS platforms like EcoMaint by Vietsoft streamline work order management, reducing time spent on physical documentation by up to 45% (Big Data in Manufacturing).
4. AI and IoT Integration
57% of major maintenance service providers plan to incorporate AI and IoT by 2026 (Global Growth Insights). These technologies enable real-time condition monitoring, reducing downtime by 20-50% (McKinsey).
5. AR/VR in Maintenance
26% of manufacturing facilities use augmented reality (AR) for equipment maintenance, with 49% citing automation as the top benefit (Resonai). AR glasses and VR simulations enhance technician training and task execution, improving efficiency by 15-35% (McKinsey).
VII. Key Maintenance Statistics for Cost and Budget Insights
6. Maintenance Cost Breakdown
Maintenance expenses account for 20-60% of a company’s operating budget (McKinsey). Digitizing operations through CMMS or ERP systems can reduce costs by 15-30%, while predictive maintenance can save up to 25% (Deloitte).
7. Cost of Unplanned Downtime
Unplanned downtime costs industrial manufacturers $50 billion annually, with an average cost of $260,000 per hour (WSJ, Machine Metrics). Proactive strategies like predictive maintenance can reduce downtime by 5-15% (Deloitte).
8. Deferred Maintenance Risks
Delaying maintenance due to budget constraints can increase future costs by 3-4 times, with operating assets to failure costing up to 10 times more than preventive programs (fnPrime, Schneider Electric).
VIII. Key Maintenance Statistics for Productivity and Efficiency Metrics
9. Work Order Backlog
A high work order backlog, often measured in hours or weeks, indicates delayed preventive maintenance due to time or resource constraints (FastMaint). A steady or decreasing backlog is a sign of effective maintenance planning.
10. Preventive vs. Reactive Maintenance
Only 51% of maintenance activities are preventive, leaving nearly half as reactive (McKinsey). Shifting to predictive maintenance can improve OEE to 50-75%, compared to less than 50% for reactive maintenance (Deloitte).
11. Wrench Time Optimization
Maintenance teams lose up to 20% of their time searching for tools or parts (fnPrime). Best-in-class organizations achieve 60-65% wrench time by implementing robust planning and scheduling (Prometheus Group).
IX. Key Maintenance Statistics for Workforce Challenges
12. Skills Gap and Hiring Issues
73% of businesses face challenges hiring maintenance technicians, with 69% of workers aged 50 or older (McKinsey, Plant Engineering). Knowledge transfer programs are critical, yet only 55% of companies have formal systems for documentation (McKinsey).
13. Technician Involvement in Predictive Maintenance
79% of facilities involve technicians in predictive maintenance, primarily at lower maturity levels (PwC). Training and upskilling are essential to advance to higher levels like PdM 4.0.
X. Key Maintenance Statistics for Safety and Sustainability
14. Safety Violations
Maintenance-related fall protection violations led to $47.4 million in fines in 2023, with 337 fatalities among maintenance workers (MSC, U.S. Bureau of Labor Statistics). Data-driven safety protocols can reduce risks by 14% (PwC).
15. Sustainability Benefits
Proactive maintenance reduces energy consumption by 5-15% and raw material usage by 20% (Quant, Hrcak). These practices align with sustainability goals, minimizing environmental impact.
XI. Trends Shaping Key Maintenance Statistics in 2025
1. AI-Powered Predictive Maintenance
AI and machine learning are revolutionizing predictive maintenance, with digital twins enabling real-time performance predictions. By 2026, 57% of providers will integrate AI and IoT (Global Growth Insights).
2. Sustainability-Driven Practices
Sustainability is a growing priority, with companies adopting energy-efficient systems and lifecycle assessments to reduce carbon footprints (Infraspeak).
3. Collaborative Platforms
Smart platforms like CMMS EcoMaint by Vietsoft enable cross-departmental collaboration, providing real-time visibility into asset health and work orders.
4. AR/VR for Training and Execution
AR and VR are transforming technician training, with immersive simulations improving skills without disrupting operations (Resonai).
5. Edge Computing for Real-Time Insights
Edge computing processes data at the source, enabling faster decision-making in low-connectivity environments (Infraspeak).
XII. How EcoMaint by Vietsoft Leverages Key Maintenance Statistics
For maintenance managers seeking to harness Key Maintenance Statistics, EcoMaint by Vietsoft offers a powerful solution. This CMMS platform centralizes data collection, enabling real-time tracking of metrics like work order backlog, MTBF, and OEE. With features like predictive maintenance analytics, mobile access for technicians, and automated reporting, EcoMaint helps organizations reduce downtime by up to 20%, cut maintenance costs by 15-30%, and improve wrench time by streamlining workflows. By integrating AI and IoT, EcoMaint aligns with 2025 trends, ensuring your facility stays competitive and efficient.
Curious about how EcoMaint can transform your maintenance operations? Discover CMMS EcoMaint here.
Contact us via hotline: 0986778578 or email: sales@vietsoft.com.vn.
XIII. Conclusion
Key Maintenance Statistics are more than just numbers—they’re the foundation of modern maintenance management. By understanding metrics like downtime, maintenance costs, and technology adoption rates, organizations can optimize operations, reduce costs, and enhance safety and sustainability. As the industry evolves in 2025, embracing tools like EcoMaint by Vietsoft will empower maintenance teams to stay ahead of challenges and capitalize on opportunities. Start tracking these statistics today to build a more efficient, reliable, and future-ready maintenance strategy.


