In industrial maintenance, recurring equipment failures disrupt operations, escalate costs, and compromise safety. Quick fixes may temporarily restore functionality, but they often fail to address the underlying issues, leading to repeated problems. Root Cause Analysis (RCA) is a systematic methodology that identifies the fundamental causes of failures, enabling maintenance teams to implement lasting solutions. This article provides an in-depth exploration of Root Cause Analysis in maintenance, focusing on its definition, importance, methods.
I. What is Root Cause Analysis (RCA) in Maintenance?
Root Cause Analysis (RCA) is a structured process designed to identify the underlying reasons for equipment failures, operational inefficiencies, or safety incidents in maintenance operations. Unlike reactive troubleshooting, which addresses symptoms, RCA digs deeper to uncover the root causes, ensuring problems are resolved permanently to prevent recurrence.
For instance, if a centrifugal pump fails repeatedly, replacing the impeller might restore operation temporarily, but RCA investigates why the impeller failed—perhaps due to cavitation, misalignment, or inadequate maintenance schedules. By addressing these root causes, maintenance teams can eliminate the issue entirely.
II. Key Characteristics of RCA
- Structured Methodology: RCA employs a step-by-step approach, using tools like the 5 Whys, Fishbone Diagrams, or Failure Mode and Effects Analysis (FMEA) to systematically trace issues to their origins.
- Data-Driven Insights: It relies on maintenance logs, failure histories, operational data, and environmental conditions to identify patterns and causes.
- Cross-Functional Collaboration: RCA often involves maintenance technicians, operators, engineers, and managers to provide diverse perspectives.
- Preventive Focus: The goal is to eliminate root causes, preventing future failures and enhancing equipment reliability.
By adopting RCA, maintenance teams transition from reactive repairs to proactive problem-solving, aligning with modern maintenance strategies like Risk-Based Maintenance (RBM).
III. Why is Root Cause Analysis Important in Maintenance?
Root Cause Analysis in maintenance delivers significant benefits that enhance operational efficiency, reduce costs, and improve safety. Below are the key reasons why RCA is critical for maintenance operations.
1. Preventing Recurring Failures
Recurring failures cause unplanned downtime, disrupting production and increasing costs. RCA identifies root causes—such as improper installation, material defects, or environmental factors—and implements solutions to prevent recurrence.
2. Reducing Maintenance Costs
Repeatedly addressing the same issue consumes spare parts, labor, and time. RCA minimizes these costs by resolving root causes.
3. Enhancing Safety
Equipment failures can create safety hazards, such as electrical faults or mechanical breakdowns. RCA eliminates these risks by addressing root causes..
4. Improving Product Quality
Maintenance issues can compromise product quality. For instance, a temperature control failure in a manufacturing process might produce defective products. RCA identifies causes like sensor drift or control system errors, ensuring consistent quality. Resolving a recurring issue in a packaging line, for example, reduces waste and improves output consistency.
5. Supporting Informed Decision-Making
RCA provides actionable insights for strategic decisions, such as:
- Repair vs. Replace: If RCA reveals a machine’s design flaw, replacing it may be more cost-effective than repeated repairs.
- Maintenance Strategy Optimization: RCA might highlight ineffective preventive maintenance tasks, prompting adjustments like increased inspection frequency.
- Spare Parts Management: By resolving root causes, RCA can reduce the need to stock certain parts, optimizing inventory.
6. Aligning with Risk-Based Maintenance (RBM)
RCA is a cornerstone of Risk-Based Maintenance (RBM), which prioritizes maintenance tasks based on the risk and impact of equipment failures. By identifying high-risk failure modes, RCA informs RBM strategies, ensuring resources are allocated to critical assets.
IV. Key Methods for Conducting Root Cause Analysis in Maintenance
To effectively perform Root Cause Analysis in maintenance, several proven methods can be applied, each tailored to specific problem types and complexities. Below, we explore these methods in detail, including practical steps, calculations, and applications to ensure maintenance teams can implement them effectively.
1. The 5 Whys Technique
The 5 Whys is a straightforward method that involves asking “Why?” repeatedly (typically five times) to drill down to the root cause. It is ideal for simple to moderately complex issues.
How to Implement the 5 Whys
- Step 1: Clearly define the problem. Example: “The production line stops every 4 hours due to a motor overload.”
- Step 2: Ask “Why?” and record the answer. Example: “The motor overloads because it’s overheating.”
- Step 3: Continue asking “Why?” for each answer until the root cause is identified. Example:
- Why does the motor overheat? Because the cooling fan is not working.
- Why is the fan not working? Because it’s clogged with dust.
- Why is it clogged? Because there’s no regular cleaning schedule.
- Why is there no cleaning schedule? Because maintenance tasks are not automated.
- Root Cause: Lack of an automated maintenance tracking system.
- Solution: Implement a CMMS like EcoMaint to schedule and track cleaning tasks.
Practical Application
- Use Case: A packaging machine frequently jams, causing 20 minutes of downtime per incident. Using the 5 Whys, the team discovers the root cause is inadequate operator training on material loading, leading to jams. The solution involves implementing a training program and standard operating procedures (SOPs).
- Calculation: If jams occur 5 times daily, costing $500 per downtime event, the annual cost is 5 × $500 × 250 working days = $625,000. Resolving the root cause could save this amount annually.
2. Fishbone Diagram (Ishikawa)
The Fishbone Diagram, also known as the Ishikawa Diagram, categorizes potential causes into groups (e.g., People, Processes, Equipment, Materials, Environment, Management) to visually map out contributing factors.
How to Create a Fishbone Diagram
- Step 1: Write the problem at the head of the diagram (e.g., “Compressor Failure”).
- Step 2: Draw a backbone with branches for categories (e.g., Equipment, Processes).
- Step 3: Brainstorm potential causes for each category and add sub-branches. Example:
- Equipment: Worn bearings, outdated components.
- Processes: Infrequent maintenance, incorrect settings.
- People: Lack of training, operator error.
- Step 4: Analyze the diagram to identify the most likely root cause, such as inadequate maintenance schedules.
- Step 5: Validate findings with data (e.g., maintenance logs showing missed inspections).
Practical Application
- Use Case: A cooling tower shuts down due to scaling. The Fishbone Diagram reveals causes like improper water treatment (Process), low-quality chemicals (Materials), and lack of operator oversight (People). The root cause is identified as inadequate water treatment protocols, leading to revised treatment schedules.
- Calculation: If scaling causes 10 shutdowns annually, each costing $10,000 in downtime, the total loss is $100,000. Implementing proper water treatment could eliminate these costs.
3. Failure Mode and Effects Analysis (FMEA)
FMEA systematically evaluates potential failure modes, their causes, and impacts, prioritizing them based on risk. It is ideal for critical systems where failures have significant consequences.
How to Conduct FMEA
- Step 1: List all components or process steps (e.g., pump, valve, motor).
- Step 2: Identify potential failure modes (e.g., pump cavitation, valve leakage).
- Step 3: Determine the effects (e.g., production stoppage, safety hazard).
- Step 4: Assign ratings for:
- Severity (S): Impact of failure (1–10, where 10 is catastrophic).
- Occurrence (O): Likelihood of failure (1–10, where 10 is frequent).
- Detection (D): Likelihood of detecting the failure before it occurs (1–10, where 10 is undetectable).
- Step 5: Calculate the Risk Priority Number (RPN) using the formula: [ RPN = S \times O \times D ]
- Step 6: Prioritize failure modes with the highest RPNs and develop corrective actions.
Practical Application
- Use Case: A hydraulic pump fails frequently. FMEA identifies cavitation as a failure mode with:
- Severity: 8 (significant downtime).
- Occurrence: 7 (frequent failures).
- Detection: 6 (difficult to detect early).
- RPN: ( 8 \times 7 \times 6 = 336 ). The root cause is inadequate fluid levels. Corrective actions include installing level sensors and adjusting maintenance schedules.
- Calculation: If each failure costs $15,000 and occurs 12 times annually, the total cost is $180,000. Implementing sensors ($5,000) could prevent these failures, yielding a net savings of $175,000.
4. Fault Tree Analysis (FTA)
FTA uses a tree diagram to map failure pathways, employing Boolean logic to identify combinations of causes. It is suitable for complex systems.
How to Conduct FTA
- Step 1: Define the undesired event (e.g., “Power Distribution Failure”).
- Step 2: Identify immediate causes (e.g., circuit breaker trip, overload).
- Step 3: Break down each cause into sub-causes (e.g., overload due to excessive load or insulation failure).
- Step 4: Use logical operators (AND, OR) to connect causes. For example, a breaker trip may require both overload AND insulation failure.
- Step 5: Continue until root causes are identified (e.g., inadequate load management).
- Step 6: Calculate failure probabilities if data is available. For example, if the probability of overload is 0.1 and insulation failure is 0.05, the combined probability (AND gate) is: [ P = 0.1 \times 0.05 = 0.005 ]
Practical Application
- Use Case: A manufacturing plant experiences frequent power outages. FTA reveals that outages occur when both a high load (OR) and poor insulation (AND) are present. The root cause is inadequate load monitoring, addressed by installing smart meters.
- Calculation: If outages cost $20,000 each and occur 8 times annually, the total cost is $160,000. Smart meters ($10,000) could prevent outages, saving $150,000.
5. Pareto Analysis
Pareto Analysis applies the 80/20 rule, identifying the 20% of causes responsible for 80% of problems.
How to Conduct Pareto Analysis
- Step 1: List all problems or causes (e.g., machine failures, downtime events).
- Step 2: Measure their frequency or impact (e.g., hours of downtime, cost).
- Step 3: Rank causes in descending order.
- Step 4: Create a Pareto chart with causes on the x-axis and cumulative impact on the y-axis.
- Step 5: Focus RCA on the top 20% of causes.
Practical Application
- Use Case: A plant experiences 100 downtime events annually. Pareto Analysis shows 20% of machines (e.g., 5 out of 25) cause 80% of downtime (80 hours). RCA on these machines reveals root causes like outdated components, leading to upgrades.
- Calculation: If downtime costs $1,000 per hour, the 80 hours cost $80,000. Upgrading machines ($20,000) could reduce downtime by 80%, saving $64,000 annually.
V. How to Conduct a Root Cause Analysis in Maintenance
Conducting Root Cause Analysis in maintenance requires a structured approach to ensure thorough investigation and effective solutions. Below is a detailed guide, including practical steps, tools, and integration with Risk-Based Maintenance (RBM).
1. Step 1: Define the Problem
Clearly articulate the issue with specific, measurable details. For example:
- Problem Statement: “The injection molding machine produces 10% defective parts daily, costing $2,000 in rework and scrap.”
- Details: Include symptoms (defective parts), frequency (daily), and impact (cost, production delays).
- RBM Integration: Assess the risk of the problem. If defective parts affect customer satisfaction or regulatory compliance, prioritize RCA to mitigate high-risk impacts.
2. Step 2: Collect Data
Gather comprehensive data to understand the problem’s context. Sources include:
- Maintenance Logs: Review past repairs and failure patterns.
- Operational Data: Collect data on operating conditions (e.g., temperature, pressure).
- Operator Feedback: Interview operators for insights on unusual behaviors.
- Environmental Factors: Note conditions like humidity or dust levels.
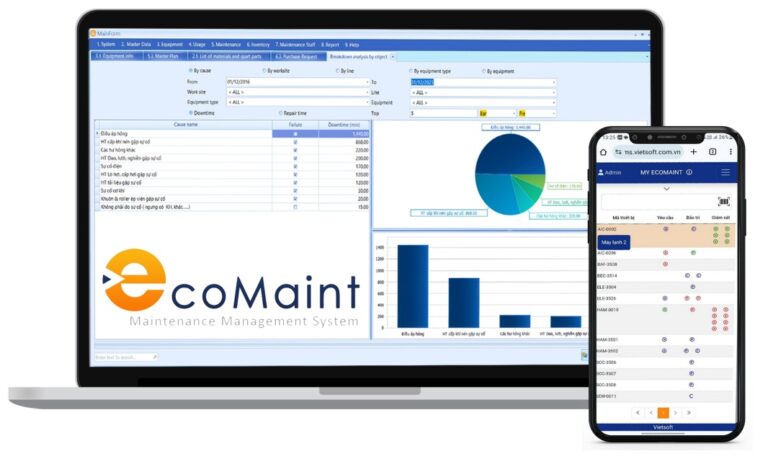
- Tools: Use a CMMS like EcoMaint to centralize data, enabling quick access to failure histories and trends.
Example
For a failing conveyor belt, collect:
- Belt age: 2 years.
- Load weight: 500 kg average.
- Maintenance history: Last inspected 6 months ago.
- Environmental data: High dust levels in the facility.
3. Step 3: Analyze Using RCA Tools
Apply appropriate RCA methods to identify potential causes. Combine multiple tools for complex issues:
- 5 Whys: Quickly identify straightforward causes (e.g., lack of maintenance).
- Fishbone Diagram: Categorize causes for multifaceted problems.
- FMEA: Prioritize high-risk failure modes using RPN calculations.
- FTA: Map complex system failures with multiple contributing factors.
RBM Integration
Use FMEA to align RCA with RBM. Calculate RPNs to prioritize failure modes with high severity or occurrence, ensuring maintenance resources focus on critical assets. For example, if a pump’s failure has an RPN of 300 due to high severity (8) and occurrence (5), prioritize it over a valve with an RPN of 100.
4. Step 4: Identify Root Causes
Distinguish between direct causes (e.g., worn bearings) and root causes (e.g., inadequate lubrication). Validate findings with data and cross-functional input. For example, if a motor fails, confirm whether the cause is electrical (e.g., voltage spikes) or mechanical (e.g., misalignment) using diagnostic tools like vibration analysis.
Example
- Problem: Frequent motor failures.
- Direct Cause: Overheating.
- Root Cause: Inadequate cooling due to clogged vents from poor maintenance planning.
- Validation: Maintenance logs show no cleaning tasks in the past year.
5. Step 5: Develop Corrective Actions
Create an action plan to address root causes, prioritizing cost-effective and sustainable solutions. Examples include:
- Equipment Upgrades: Replace outdated components.
- Process Changes: Revise maintenance schedules or SOPs.
- Training: Address human errors through skill development.
- RBM Integration: Align corrective actions with risk priorities. For high-risk assets, implement condition-based monitoring (e.g., vibration sensors) to prevent recurrence.
Example
- Root Cause: Inadequate cooling due to clogged vents.
- Corrective Action: Implement a monthly vent cleaning schedule via CMMS EcoMaint and install air filters to reduce dust ingress.
- Cost-Benefit Analysis: Cleaning costs $500/month, but prevents failures costing $10,000 each, saving $9,500 per failure.
6. Step 6: Implement and Monitor
Execute corrective actions and track their effectiveness using metrics like:
- Mean Time Between Failures (MTBF): Calculate as: [ MTBF = \frac{\text{Total Operating Time}}{\text{Number of Failures}} ] Example: If a machine operates 8,000 hours annually with 4 failures, MTBF = 8,000 ÷ 4 = 2,000 hours. Post-RCA, aim to increase MTBF.
- Downtime Reduction: Measure downtime before and after RCA implementation.
- Cost Savings: Track reductions in repair and parts costs.
Use CMMS EcoMaint to automate task assignments, monitor outcomes, and generate reports. For example, if MTBF increases to 4,000 hours after implementing cleaning schedules, RCA has doubled equipment reliability.
RBM Integration
Monitor high-risk assets identified in FMEA using real-time data from IoT sensors or CMMS EcoMaint. Adjust maintenance intervals based on RCA findings to optimize resource allocation.
VII. Integrating RCA with CMMS EcoMaint for Enhanced Maintenance
Vietsoft’s CMMS EcoMaint is a powerful tool that enhances Root Cause Analysis in maintenance by streamlining data collection, analysis, and action implementation. Key features include:
- Centralized Data Repository: Stores maintenance logs, failure histories, and operational data, enabling quick access for RCA.
- Automated Work Orders: Assigns and tracks corrective actions based on RCA findings, ensuring timely implementation.
- Real-Time Analytics: Identifies failure trends, supporting proactive RCA.
- RBM Support: Prioritizes maintenance tasks based on risk, aligning with FMEA and RCA outcomes.
Discover CMMS EcoMaint here. Contact us via hotline: 0986778578 or email: sales@vietsoft.com.vn.
VIII. When to Apply Root Cause Analysis in Maintenance
RCA is most effective in the following scenarios:
- Post-Incident Investigations: After major failures (e.g., boiler shutdown), RCA identifies systemic issues like design flaws or missed inspections.
- Recurring Problems: For persistent issues (e.g., pump cavitation), RCA uncovers causes like improper fluid levels, saving resources.
- Safety Incidents: RCA investigates events like equipment jams to address causes like inadequate guarding, enhancing safety.
- Routine Maintenance Reviews: Proactively analyze data to identify trends (e.g., motor failures due to voltage spikes), enabling preventive measures.
- Continuous Improvement: Use RCA to optimize maintenance schedules and processes, aligning with RBM principles.
IX. Conclusion
Root Cause Analysis (RCA) in maintenance is a transformative approach that shifts maintenance from reactive to proactive, addressing the underlying causes of failures to ensure long-term reliability, cost savings, and safety. By leveraging methods like the 5 Whys, Fishbone Diagrams, FMEA, and FTA, maintenance teams can systematically uncover root causes and implement effective solutions. Integrating RCA with Risk-Based Maintenance and tools like Vietsoft’s CMMS EcoMaint enhances its impact, enabling data-driven decisions and optimized resource allocation.