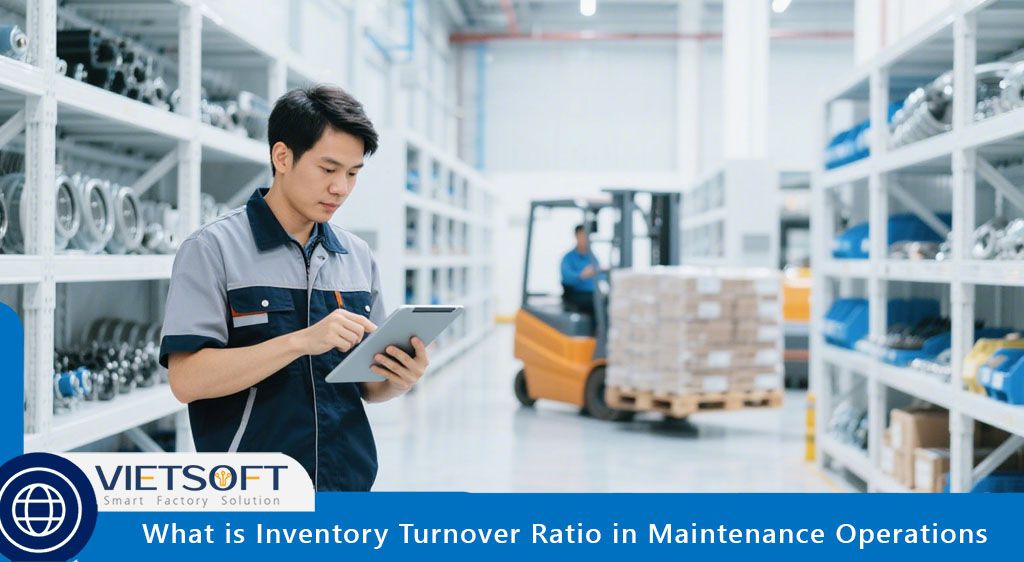
In the intricate world of industrial maintenance, efficiency isn’t just a buzzword—it’s the bedrock of sustainable operations and profitability. Maintenance programs rely on a suite of metrics to gauge equipment performance, evaluate team effectiveness, and pinpoint areas for enhancement. Among these, the inventory turnover ratio stands out as a particularly insightful indicator, offering a clear lens into both the utilization of assets and the efficacy of the overall maintenance strategy. By closely tracking this ratio, organizations can gain a deeper understanding of how effectively they manage spare parts, control costs, and ultimately drive greater profitability.
I. Understanding the Inventory Turnover Ratio in a Maintenance Context
At its core, the inventory turnover ratio quantifies how frequently a company replaces its inventory over a specific period, most commonly a single year. In the realm of industrial maintenance, this metric specifically measures how often spare parts, consumables, and other maintenance, repair, and operations (MRO) inventory are used and replenished.
A high inventory turnover ratio generally signals that an organization is managing its maintenance inventory levels effectively. This indicates efficient resource utilization and a minimization of the carrying costs associated with excessive inventory or the premium prices often incurred with last-minute, urgent orders. Conversely, a low inventory turnover ratio can point to underlying issues such as overstocking, obsolete parts, or inefficient maintenance planning.
This crucial metric empowers maintenance teams to make data-driven decisions that lead to long-term operational improvements. It supports:
- Strategic Resource Allocation: Guiding decisions on how to best deploy capital, physical assets, and personnel.
- Proactive Maintenance Strategies: Reinforcing the importance of routine servicing and regularly scheduled inspections to ensure parts are utilized rather than sitting idle.
- Accountability and Performance: Providing a quantifiable method for team members to understand the tangible impact of their efforts on inventory turnover and overall equipment efficiency.
- Continuous Monitoring and Forecasting: Enhancing the ability to predict future maintenance needs and adjust inventory accordingly.
- Improved Alignment: Fostering better coordination between maintenance schedules, production timelines, and inventory management practices.
II. Deconstructing the Inventory Turnover Ratio Formula
Calculating the inventory turnover ratio involves a straightforward formula that yields powerful insights. The most widely accepted formula is:
Inventory Turnover Ratio = Cost of Goods Sold (COGS) / Average Inventory
Let’s break down the components of this formula in a maintenance setting:
- Cost of Goods Sold (COGS): In a manufacturing or production environment, COGS typically represents the direct costs associated with producing goods. For maintenance, it’s analogous to the total cost of maintenance consumables and spare parts utilized over the specified period. This includes the direct expenses of purchasing and, if applicable, internal production or refurbishment of these items.
- Average Inventory: This figure accounts for the average monetary value of all maintenance-related items held in stock throughout the period. It’s calculated by taking the sum of the inventory value at the beginning of the period and the inventory value at the end of the period, then dividing by two.
Average Inventory = (Beginning Inventory Value + Ending Inventory Value) / 2
For instance: if a plant’s maintenance department had $150,000 worth of spare parts at the start of the year and $210,000 at the end, their average inventory would be:
($150,000 + $210,000) / 2 = $180,000
If the total cost of parts consumed for maintenance over that year was $900,000, the inventory turnover ratio would be:
$900,000 / $180,000 = 5
This ratio of 5 indicates that the maintenance inventory was “turned over” or replaced five times during the year.
III. How to Calculate Inventory Turnover Ratio: A Step-by-Step Guide
Calculating your maintenance inventory turnover ratio is a systematic process that provides clear, actionable data. Follow these steps to determine this crucial metric for your operations:
1. Step 1: Gather the Necessary Data
To calculate the inventory turnover ratio, you will need two primary pieces of financial data from a specific period, typically a quarter or a year:
- Cost of Goods Sold (COGS) for Maintenance: In the context of maintenance, this refers to the total cost of all spare parts and consumables that were actually used or “sold” (i.e., issued from inventory for maintenance work) during the given period. This includes the direct expenses associated with purchasing or acquiring these items.
- Beginning Inventory Value: The total monetary value of your maintenance inventory at the very start of the chosen period.
- Ending Inventory Value: The total monetary value of your maintenance inventory at the very end of the chosen period.
2. Step 2: Calculate Average Inventory
The average inventory value smooths out any temporary peaks or dips in your inventory levels, providing a more stable and reliable measure, especially for periods with seasonal fluctuations or large, infrequent purchases.
Use the following formula to calculate your average inventory value:
Average Inventory = (Beginning Inventory Value + Ending Inventory Value) / 2
Example: Let’s assume a one-year measurement period for a manufacturing plant’s maintenance department:
- Beginning Inventory Value (January 1st) = $150,000
- Ending Inventory Value (December 31st) = $210,000
Applying the formula: Average Inventory = ($150,000 + $210,000) / 2 = $360,000 / 2 = $180,000
So, the average maintenance inventory held during that year was $180,000.
3. Step 3: Perform the Inventory Turnover Ratio Calculation
Now that you have both the Cost of Goods Sold (or Cost of Parts Used) and the Average Inventory, you can compute the inventory turnover ratio:
Inventory Turnover Ratio = Cost of Goods Sold (Maintenance) / Average Inventory
Example (continuing from above): Let’s say the total Cost of Goods Sold for maintenance (i.e., value of parts consumed) for the same year was $900,000.
Applying the formula: Inventory Turnover Ratio = $900,000 / $180,000 = 5
This result of 5 indicates that, over the course of that year, the maintenance department effectively sold and replaced its inventory of spare parts and consumables five times.
4. Step 4: Analyze Your Results
The final step is to interpret your calculated ratio. A higher number generally suggests efficient inventory management and active use of parts, while a lower number could indicate issues like overstocking or slow-moving inventory. Compare your ratio against industry benchmarks and your own historical data to identify trends and inform future process improvements.
IV. Inventory Turnover Ratio vs. Stock Turnover Ratio: Are They the Same?
Often, the terms “inventory turnover ratio” and “stock turnover ratio” are used interchangeably, and indeed, both metrics aim to measure how efficiently an organization replaces its holdings. They are calculated using the same fundamental formula.
The preference for one term over the other can often depend on specific industry conventions or the type of items being discussed:
- Industry Preference: Retailers, for example, might favor “stock turnover” when referring to customer-facing products, while manufacturers might lean towards “inventory turnover” when describing the usage of consumables within their production processes.
- Inventory Type: A manufacturing entity might use “inventory turnover” to track raw materials used in production and “stock turnover” for finished goods ready for sale. In maintenance, the term “inventory turnover ratio” is generally more applicable as it refers to the consumption of MRO items that are integral to asset upkeep and operational continuity.
- Area of Operation: “Stock turnover” might be more relevant in sales and customer-facing departments, whereas “inventory turnover” is predominantly used in areas like production, asset management, and crucially, maintenance.
V. Unlocking Maintenance Insights from Inventory Turnover Ratio
While commonly associated with broader business budget management and purchasing decisions, the inventory turnover ratio offers a treasure trove of insights specifically for maintenance teams. It provides valuable perspectives on:
- Resource Allocation Optimization: Guiding data-driven decisions regarding the most efficient use of capital, physical assets, and personnel within the maintenance department.
- Operational Efficiency: Identifying bottlenecks or inefficiencies in the procurement, storage, and usage of spare parts. A low turnover might suggest excess inventory tying up capital, while a very high one could indicate insufficient stock leading to potential downtime.
- Equipment Utilization and Performance: Indirectly reflecting the health of equipment. If a certain part has a very high turnover, it might indicate a frequently failing component or an asset requiring excessive repairs, prompting investigation into root causes.
- Preventive Maintenance Scheduling Practices: Highlighting whether PM schedules are effectively reducing unexpected failures and thus optimizing parts usage. Well-executed PM can lead to a more predictable and efficient inventory flow.
- Cost Management: Directly impacting holding costs (warehousing fees, insurance, obsolescence) and the potential for lost production due to unavailable parts. Faster turnover generally translates to lower holding costs.
- Future Maintenance Budgeting: Informing decisions about equipment upgrades or replacements by revealing which parts are consumed most frequently and at what cost. This data can justify investments in more reliable components or newer machinery.
VI. What Constitutes a “Good” Inventory Turnover Ratio?
Defining a “good” inventory turnover ratio isn’t a one-size-fits-all answer, as it can vary significantly across industries and even within different segments of a single business. However, some general guidelines apply:
- Low Ratio (typically 1-2): This often suggests overstocking, poor purchasing decisions, or a lack of demand for certain items. In maintenance, it could mean having too many slow-moving or obsolete spare parts.
- Good Ratio (typically 3-6): In many industries, this range indicates a balanced inventory management strategy, where items are moving efficiently without excessive stockouts or oversupply.
- Excellent Ratio (7 or higher): This suggests robust inventory movement. For maintenance, it could mean highly optimized parts usage and effective maintenance planning.
However, the most crucial factor is benchmarking against industry standards. Different industries have unique sales cycles, production cycles, profit margins, capital expenses, and seasonal fluctuations. Therefore, a “good” inventory turnover ratio must be considered relative to your specific industry’s benchmark. For instance, a fast-moving consumer goods company will naturally have a much higher turnover than a heavy machinery manufacturer.
VII. Strategies for Improving Inventory Turnover Ratio in Maintenance
Even incremental improvements in a maintenance department’s inventory turnover ratio can translate into significantly enhanced efficiency, cash flow, and overall profitability. While a higher ratio is generally preferable, the aim should always be to achieve an optimal turnover that balances cost savings with operational readiness.
Here are several strategies maintenance teams can employ to improve their inventory turnover ratio:
- Leverage Data Analytics: Implement robust analytics to track historical parts consumption, identify usage trends, and forecast future demand more accurately. This allows for more informed purchasing and inventory adjustments.
- Foster Strong Supplier Relationships: Cultivate partnerships with reliable suppliers to ensure timely restocking based on actual usage and projected demand, reducing the need for excessive buffer stock.
- Adopt Just-in-Time (JIT) Inventory Practices: Where feasible, implement JIT principles for certain high-usage or critical spare parts. This minimizes overstocking and aligns stock levels, maintenance schedules, and production activities with actual demand, thereby reducing holding costs and improving cash flow.
- Streamline Processes with Maintenance Management Software: Modern Computerized Maintenance Management Systems (CMMS) play a pivotal role in optimizing inventory.
- Standardize Parts: Where possible, standardize components across similar equipment to reduce the variety of spare parts needed, simplifying inventory management and improving turnover.
- Implement Robust Preventive and Predictive Maintenance: By proactively addressing potential equipment failures, the need for emergency part replacements can be reduced, leading to more predictable and controlled inventory usage.
- Regular Inventory Audits and Obsolescence Management: Periodically review inventory for obsolete or slow-moving parts. Develop a strategy for liquidating or disposing of these items to free up capital and storage space.
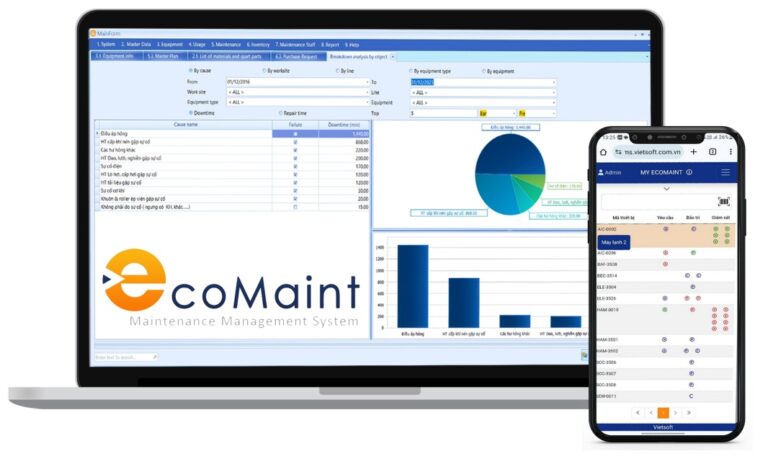
VIII. How EcoMaint Enhances Your Inventory Turnover Ratio
Optimizing your inventory turnover ratio in maintenance requires robust tools that provide real-time visibility and intelligent data analysis. Vietsoft’s EcoMaint CMMS is specifically designed to empower maintenance teams in Vietnam to achieve these goals, offering a comprehensive solution for streamlined inventory management.
EcoMaint provides features that directly address the challenges of parts management and contribute to a healthier inventory turnover ratio:
- Real-time Stock Level Visibility: Gain instant insights into current stock levels for every spare part and consumable. This immediate data helps prevent over-ordering and identifies critical shortages before they impact operations.
- Automated Reorder Points: Set up automated reorder points based on historical consumption rates and lead times, ensuring that parts are replenished precisely when needed, supporting Just-in-Time principles without risking stockouts.
- Historical Data Analysis and Demand Forecasting: EcoMaint’s powerful analytical capabilities allow you to review past usage trends, forecast future demand accurately, and make informed purchasing decisions that align with actual maintenance needs.
- Comprehensive Inventory Management Tools: Manage stock locations, track part movements, conduct cycle counts, and categorize inventory effectively. This level of control minimizes lost or misplaced items and ensures accurate inventory records.
- Integration with Work Orders: Seamlessly link spare parts to work orders, providing a clear picture of parts consumption per job. This helps in understanding which assets are driving higher part usage and refining maintenance strategies.
- User-Friendly, Customizable Dashboards: Visualize key inventory metrics, including turnover rates, through intuitive dashboards. This allows maintenance managers to quickly identify trends and take corrective actions.
- Mobile Access: Provide your maintenance technicians with mobile access to inventory data, enabling them to check part availability, request new items, and update stock information directly from the field, enhancing efficiency and accuracy.
By integrating EcoMaint into your maintenance operations, you can transform your approach to spare parts management. Discover how EcoMaint optimizes maintenance tasks, reduces carrying costs, and significantly improves your inventory turnover ratio for a more efficient and profitable operation. Discover the CMMS EcoMaint solution here.
Contact us for consultation via hotline: 0986778578 or email: sales@vietsoft.com.vn.
IX. The Enduring Importance of Calculating Inventory Turnover Ratio
Calculating the inventory turnover ratio is not merely an accounting exercise; it’s a critical tool that provides meaningful insights into the efficiency of your maintenance team, the effectiveness of your inventory management processes, and even the overarching performance of your business. This relatively straightforward formula can help your organization:
- Optimize Resource Allocation: By making data-driven decisions about the best use of capital, physical assets, and personnel, ensuring that resources are not tied up in excess or obsolete inventory.
- Plan for Fluctuations: Identify and prepare for predictable patterns in parts demand, whether seasonal or related to specific maintenance campaigns, leading to more proactive procurement.
- Reduce Holding Costs: Minimize the expenses associated with overstocking and storing goods, such as warehousing fees, insurance premiums, and the risk of spoilage or obsolescence.
- Improve Cash Flow: By turning inventory over faster, less capital is tied up in stagnant stock, freeing up funds for other critical investments or operational needs.
- Coordinate Decisions: Facilitate synchronized, data-driven decisions across production scheduling, preventive maintenance (PM) scheduling, and stock replenishment, creating a more cohesive operational environment.
- Identify Underlying Operational Issues: A consistently low or declining inventory turnover ratio can be a red flag, prompting further investigation into root causes such as inefficient maintenance practices, poor forecasting, or even declining asset health.
X. Conclusion
The inventory turnover ratio is an indispensable metric for any organization serious about optimizing its industrial maintenance operations. It serves as a vital barometer for assessing the efficiency of spare parts management, highlighting areas of strength and identifying opportunities for improvement. By understanding its calculation, interpreting its implications, and strategically working to optimize it, maintenance teams can significantly enhance cost control, improve operational efficiency, and contribute directly to the financial health of the enterprise. Embracing modern tools like CMMS solutions, such as Vietsoft’s EcoMaint, is key to achieving an optimal inventory turnover ratio, ensuring that the right parts are available at the right time, at the right cost, propelling your maintenance program toward peak performance.